

Visualization
"Visualization is any technique for creating images, diagrams, or animations to communicate a message. Visualization through visual imagery has been an effective way to communicate both abstract and concrete ideas since the dawn of man. Examples from history include cave paintings, Egyptian hieroglyphs, Greek geometry, and Leonardo da Vinci's revolutionary methods of technical drawing for engineering and scientific purposes." (Wikipedia) Our own research focus is the 3D Visualization, meaning the visualization of three dimensional objects. Example applications using 3D Visualization are:
- Computer Aided Construction (architecture, engineering, ...)
- the visualization of 3-dimensional medical data, for example from computer tomography,
- the visualization of landscape data, showing either status quo or future measurements.
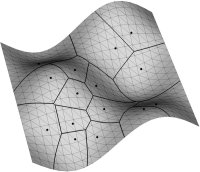
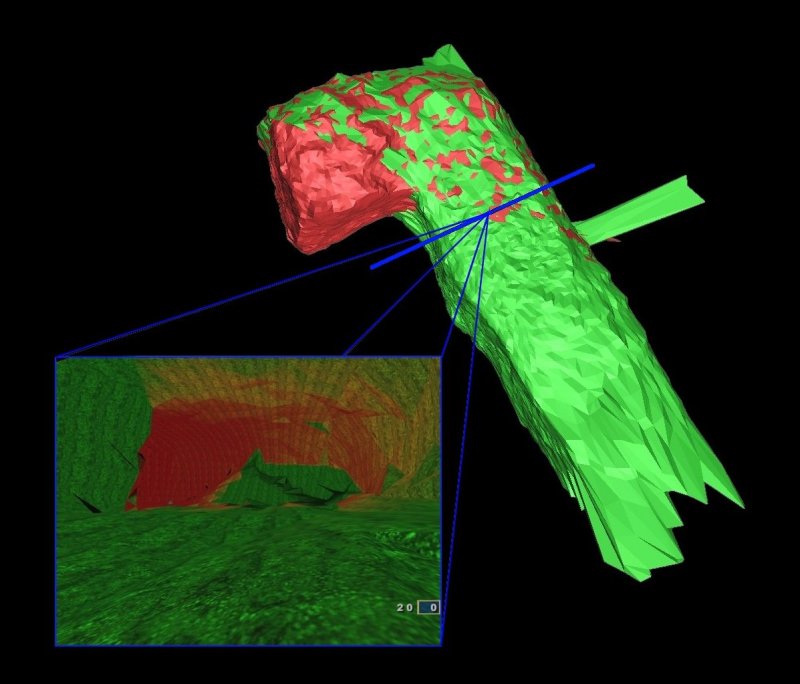
Visualization is fundamental for many geometrical problems. Whenever a new algorithm for the calculation of a 3D Voronoi Diagram or medial axis is implemented, the very first test if the new method produces the right results is usually optical.
One of the first projects of the Welfenlab was the developement of a NURBS base visualization software called "Janus" ("Just Another NUrbs System"). Despite his name, the program could visualize not only NURBS surfaces but also bezier patches (and curves), triangle surfaces, point clouds or curve-on-surface-models.
3D Visualization in the Field of Medicine
A currently very hot focus of our department is the visualization of voxel data in the field of medicine. A voxel can be seen as a three dimensional analogon of a pixel. A pixel (defined by a x-, y- and a color value) describes a point on a computer monitor, while the voxel (which contains an additional z-value) describes a three dimensional point in space. Voxel data in a medical context is gained by different imaging techniques, such as computer tomography (CT) or magnetic resonance imaging (MRI). The question remains, how such voxel data can be visualized in a human-understandable, natural way. Depending on the application it is either necessary to produce high quality images or a fast, interactive form of visualization where the user can move free around (or through) the virtual object.
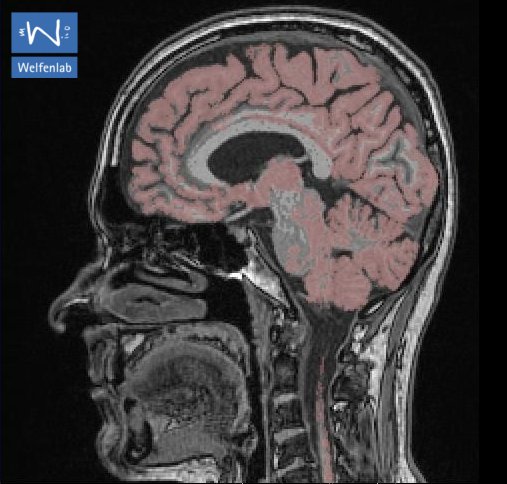
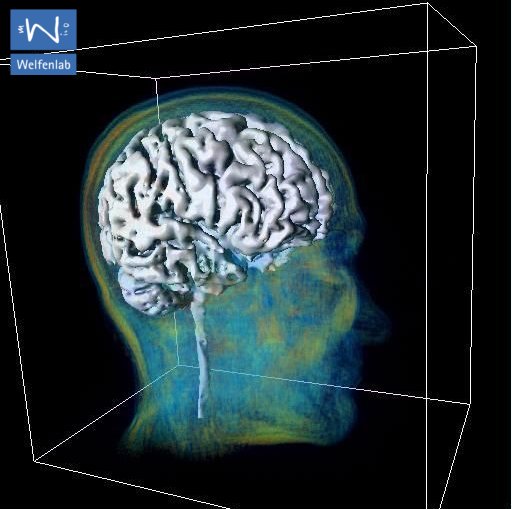
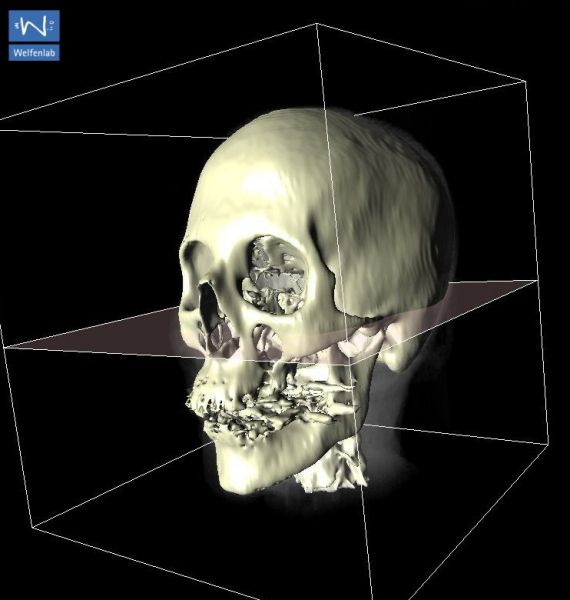
Visualization of medical voxel data is often combined with the problem of segmentation, which describes the partitioning of our (three dimensional) image into multiple regions. As an exampel, a part of a voxel data set gained by a CT scan might be described as "bone", a subset of the bone might be called "jaw". Both, "bone" and "jaw" are called segments, the process of their creation (manual or automatic) is called segmentation.
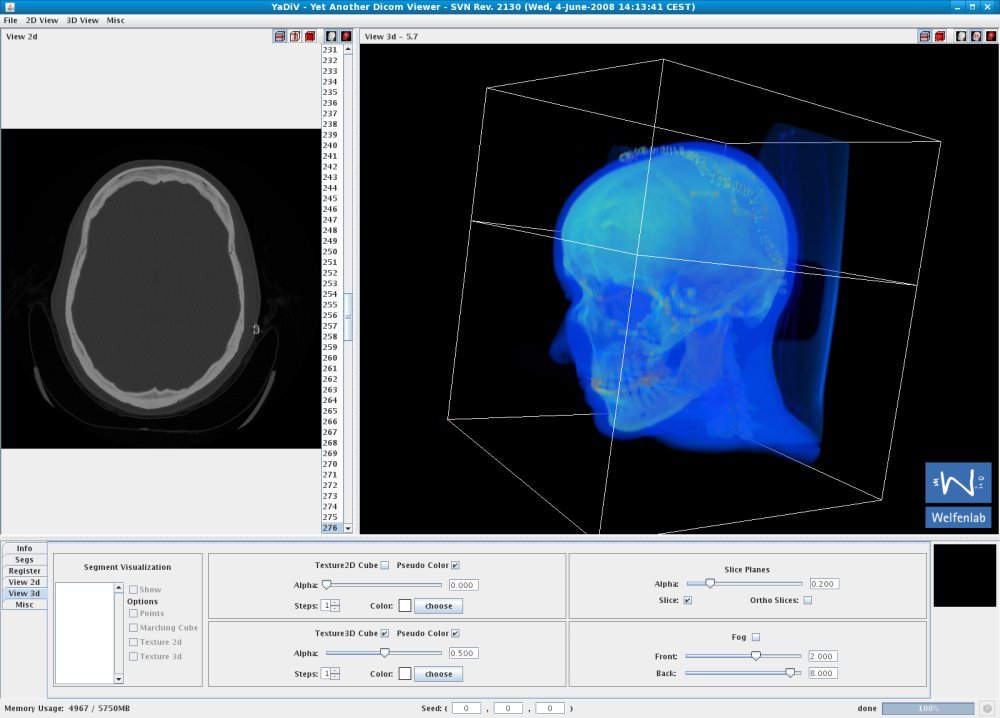
Both applications, visualization and segmentation of medical data is in the focus of our research. For this purpose, we developed the sofware YaDiV ("Yet Another Dicom Viewer"), which is able to visualize, segment and register medical data (DICOM directory format). The software is currently used as a platform for our own research and is evaluated with medical scientists from the Medizinischen Hochschule Hannover (MHH).
Visualization with Game Engines
Another focus of our visualization research is the so called "serious gaming". In the recent years, the computer gaming industry has become a large and important market and impressive amounts of money are spent on the development of new game engines. In contrast to their development costs, the price for the final product is very low compared to a professional 3D visualization/animation program.
The idea to use this potential for other purposes than gaming seems obvious.